 Small batches, high standards. Our rapid prototyping service makes validation faster and easier —

SPC and Cpk Explained: Mastering Process Capability Control

TL;DR
Statistical Process Control (SPC) is a quality control methodology that uses statistical tools to monitor, control, and improve a process. Within SPC, Cp and Cpk are crucial indices that measure a process's ability to produce output within predefined specification limits. Cp measures potential capability assuming the process is perfectly centered, while Cpk provides a more realistic picture by accounting for how centered the process actually is.
Foundations of Quality Control: What Is Statistical Process Control (SPC)?
Statistical Process Control (SPC) is a foundational methodology in modern quality management that uses statistical techniques to monitor and control a process. Its primary goal is to ensure that processes operate at their full potential to produce conforming products and services. By analyzing data in real time, SPC helps manufacturers and service providers distinguish between natural, inherent process variations (common causes) and variations that stem from specific, identifiable issues (special causes).
The importance of SPC lies in its proactive approach to quality. Instead of inspecting finished products and discarding defects—a reactive and costly method—SPC focuses on controlling the process itself. This prevents defects from occurring in the first place, leading to significant reductions in waste, scrap, and rework. According to information from Boyd Corporation, a key aim of SPC is to identify and separate natural causes of variation from special causes that can be controlled or eliminated, thus improving both accuracy and precision. This predictive power allows organizations to optimize production time and materials, ultimately creating more high-quality products efficiently.
Within the comprehensive framework of SPC, a set of powerful tools known as process capability indices are used to quantify performance. These indices provide an objective way to evaluate how well a process meets its specification limits, which are defined by customer requirements. The most fundamental of these are the Process Capability Index (Cp) and the Process Capability Index (Cpk). These metrics translate complex process data into a single, understandable number, offering a clear snapshot of process health and setting the stage for targeted improvements.
Defining Process Capability: Cp Explained
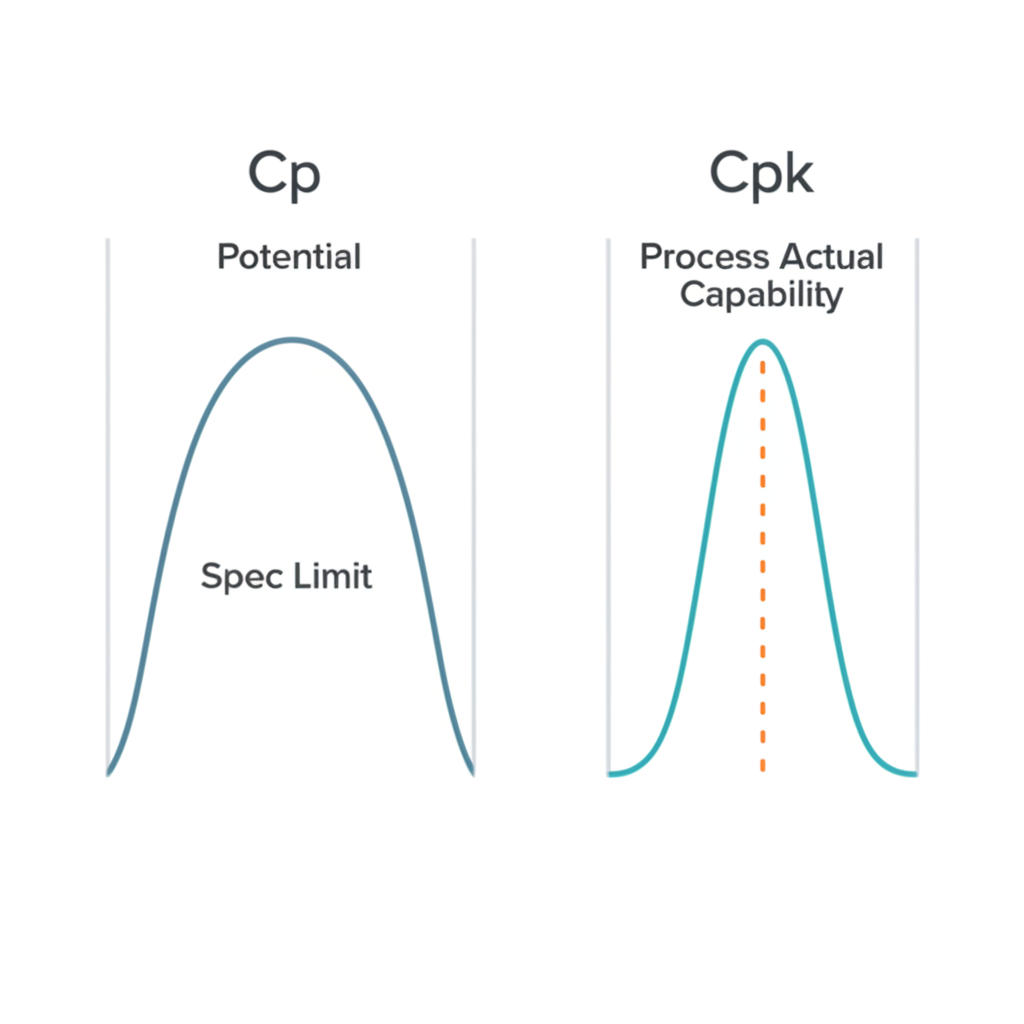
The Process Capability Index (Cp) is a straightforward metric that measures the potential of a process to meet its specifications. It answers a simple question: if the process were perfectly centered between its upper and lower specification limits, would its natural variation fit within those limits? Cp is calculated by comparing the total width of the specification (the voice of the customer) to the natural variation or spread of the process (the voice of the process).
A helpful analogy is parking a car in a garage. The width of the garage door represents the specification limits (Upper Specification Limit, USL, and Lower Specification Limit, LSL), and the width of the car represents the process spread. The Cp index tells you if the car is narrow enough to fit through the garage door, without considering whether the driver is aligned with the center of the opening. A high Cp value means the car is much narrower than the garage, indicating the process has low variation and a high potential to produce conforming parts.
However, Cp alone can be misleading because it completely ignores the process average. A process could have an excellent Cp value, suggesting its variation is small, but if its average is shifted far to one side, it will still produce a large number of defects. As noted by PresentationEZE, using Cp alone can be deceptive, but it provides a good indication of the process's best-case potential. Therefore, Cp is best used as a starting point and always in conjunction with its more insightful counterpart, Cpk.
Accounting for Reality: Cpk Explained
While Cp measures potential, the Process Capability Index (Cpk) measures the actual performance of a process by taking its centering into account. Cpk evaluates how close the process mean is to the specification limits, providing a much more realistic assessment of capability. It essentially adjusts the Cp value for any off-center shifts in the process distribution. This makes Cpk a critical tool for understanding real-world production quality.
Returning to the car and garage analogy, Cpk tells you not only if the car is narrow enough to fit (like Cp) but also if the driver has centered it properly to avoid scraping the sides. If the car is perfectly centered, the Cp and Cpk values will be identical. However, if the car is driven closer to one side of the garage door, the Cpk value will be lower than the Cp, reflecting the increased risk of producing a defect (scraping the wall). Cpk is calculated by measuring the distance from the process mean to the nearest specification limit, effectively representing the worst-case scenario.
The term Cpk stands for Process Capability Index, with the 'k' often considered a factor that represents the centering of the process. It quantifies how much the process mean has deviated from the ideal center point between the specification limits. Because it provides a more complete picture, Cpk has become one of the most widely used metrics in quality control. It answers the crucial question: is the process both consistent (low variation) and on target (well-centered)?
Practical Application: How to Interpret Cp & Cpk Values
Translating Cp and Cpk values into actionable insights is the ultimate goal of process capability analysis. These numbers are not just abstract statistics; they are direct indicators of process health and risk. A process must be stable and in a state of statistical control before these indices can be reliably interpreted. Once stability is confirmed, specific value ranges serve as industry-standard benchmarks for performance.
Understanding these benchmarks helps organizations prioritize improvement efforts and manage quality risks effectively. Here is a breakdown of common Cpk values and their practical meanings:
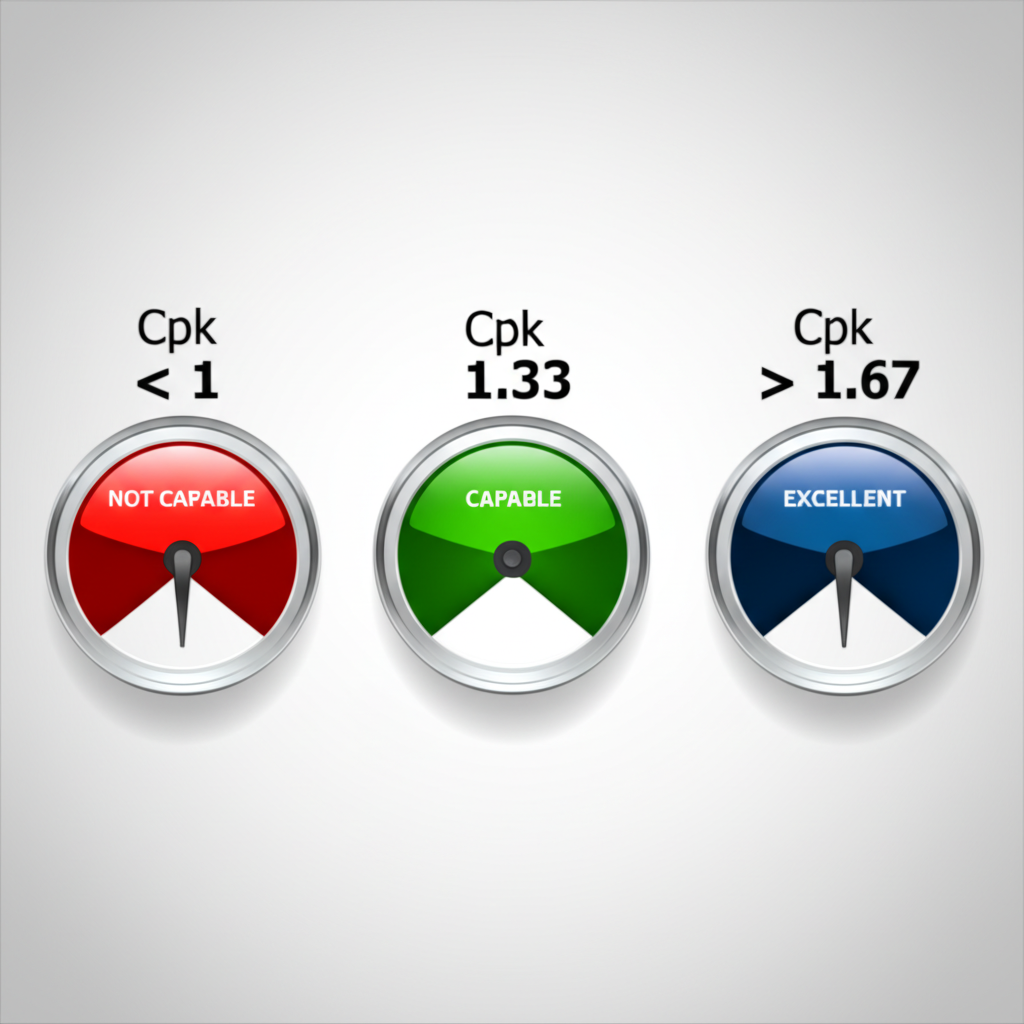
- Cpk < 1.00: The process is not capable. The process spread is wider than the specification limits, or it is so off-center that it is producing non-conforming parts. This situation requires immediate investigation and corrective action.
- Cpk = 1.00: The process is barely capable. This means the process variation fits exactly within the specification width, leaving no room for error. Any slight shift in the process average will result in defects. This level of performance is often considered unacceptable.
- Cpk between 1.00 and 1.33: The process is considered marginally capable but requires tight control and monitoring. While acceptable for some applications, there is still a significant risk of producing defects.
- Cpk ≥ 1.33: The process is capable. This is a common minimum requirement for many industries and indicates a healthy buffer between the process output and the specification limits. At Boyd, a Cpk of 1.33 or greater is a common target for their injection molding customers.
- Cpk ≥ 1.67: The process has excellent capability. This level is often required for critical-to-quality characteristics, especially in industries like automotive or aerospace where safety is paramount. Reaching this level significantly reduces defect risk.
For industries with stringent quality demands, such as automotive manufacturing, achieving a high Cpk is non-negotiable. Suppliers in this sector must demonstrate robust process control to meet standards like IATF 16949. For instance, companies providing specialized services like custom forging from Shaoyi Metal Technology rely on such rigorous quality control methods to ensure every component meets precise specifications, from small batches to mass production.
A Broader Perspective: Understanding Pp and Ppk
While Cp and Cpk are essential for understanding a process's potential capability based on short-term data, another pair of indices—Pp and Ppk—offers a view of long-term, overall performance. The key difference lies in how process variation (standard deviation) is calculated. Cp and Cpk use the 'within-subgroup' variation, which reflects the natural, short-term potential of a process. In contrast, Pp and Ppk use the 'overall' variation, which captures all process fluctuations over a longer period, including shifts and drifts between subgroups.
Essentially, Cp and Cpk predict future capability, assuming the process remains stable. Pp and Ppk evaluate historical performance, answering the question, "How did the process actually perform over time?" In a perfectly stable process, the values of Cpk and Ppk will be very close. However, if a process is unstable and experiences shifts, the Ppk value will be significantly lower than the Cpk, indicating that the long-term performance did not live up to its short-term potential. This divergence between the two indices is a powerful diagnostic tool for identifying special cause variation that may be impacting the process over time.
Think of it this way: Cpk is like a snapshot of a sprinter's top speed, while Ppk is their average speed over an entire marathon. Both metrics are valuable, but they tell different stories. Cpk is used to qualify a process and assess its potential, while Ppk is used to verify its long-term, real-world performance.
Frequently Asked Questions
1. What is SPC and Cpk?
Statistical Process Control (SPC) is a broad quality control methodology that uses statistical tools to monitor and manage a process. Cpk, or the Process Capability Index, is a specific metric within SPC that measures how well a process can produce output within its specification limits, while also accounting for how centered the process is. A Cpk value of 1.33 or higher is generally considered capable.
2. What does Cpk stand for in SPC?
Cpk stands for Process Capability Index. It is an enhancement of the Cp index, which only measures potential capability (spread). The 'k' in Cpk is a factor that accounts for the centering of the process mean relative to the specification limits. It provides a more realistic measure of a process's ability to consistently produce parts that meet customer requirements.