 Male količine, visoki standardi. Naša usluga brzog prototipiranja čini potvrdu bržom i lakošću —

7 ključnih zona FLD grafikona u AutoForm softveru
U automobilskoj industriji, računalom podržano inženjerstvo (CAE) igra ključnu ulogu u procesu razvoja proizvoda. Jedan od najnaprednijih CAE alata za simulaciju oblikovanja limova je AutoForm, koji pomaže inženjerima da predvide i spriječe greške poput pucanja, nabora i pretjeranog tankanja uz pomoć analize metodom konačnih elemenata (FEA).
Ključna značajka programa AutoForm je dijagram graničnog oblikovanja (FLD) – moćan alat koji se koristi za procjenu granica oblikovanja lima. FLD dijeli stanja deformacija materijala u sedam zona označenih bojama, što omogućuje inženjerima da vizualno procijene razinu rizika oštećenja dijela tijekom procesa oblikovanja.
Pogledajmo sedam FLD zona i što one pokazuju:
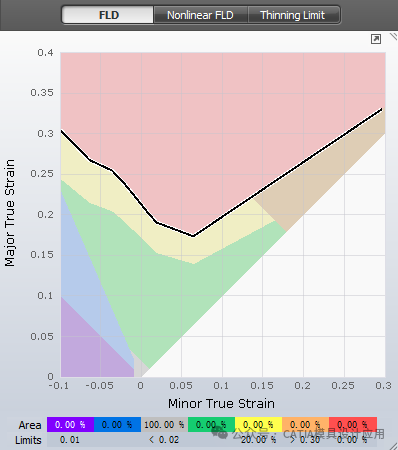
1. Zona pucanja (Crvena)
Nalazi se iznad krivulje graničnog oblikovanja (FLC), što znači da je materijal premašio svoj granični kapacitet oblikovanja i vrlo vjerojatno će puknuti. Svaka točka koja pada u ovu crvenu zonu ukazuje na odmah nastalu neispravnost i zahtijeva hitne promjene u alatu, materijalu ili procesu.
2. Zona rizika od pucanja (Žuta)
Ova zona nalazi se neposredno ispod zone pucanja i predstavlja područje visokog rizika. Iako materijal još nije pukao, radi se blizu granice njegovih mogućnosti. Preporučuje se preventivna intervencija – prilagodite parametre oblikovanja ili promijenite svojstva materijala kako bi razina deformacije bila vani ove opasne zone.
3. Zona pretjeranog otankljivanja (Narančasta)
Pretjerano otankljivanje znači da je debljina lima smanjena iznad prihvatljive granice, čime se narušava strukturna otpornost i trajnost komponente. Ovo se najčešće događa zbog prevelikog istezanja u lokalnim područjima i treba se izbjegavati kod komponenata koje su kritične za sigurnost.
4. Sigurna zona (Zelena)
Ovo je idealno stanje oblikovanja. Dijelovi koji se nalaze u ovom području su unutar optimalnog raspona deformacije, što znači da imaju malu vjerojatnost pucanja, nabora ili pretjeranog tankosti. Ovo je ciljano područje za sve kritične površine proizvoda.
5. Područje nedovoljnog istezanja (Sivo)
Kada lim ne doživi dovoljno istezanja, možda se neće potpuno prilagoditi željenom obliku. AutoForm označava ova područja sivom bojom. Iako je to ponekad prihvatljivo u nefunkcionalnim područjima poput flanša ili zona rezanja, ta područja bi trebala biti minimalizirana na površinama proizvoda kako bi se održala dimenzionalna točnost.
6. Područje sklonosti nabiranju (Plavo)
Ovo područje upućuje na rizik nabiranja. Iako još nije došlo do otkazivanja, nabori se mogu pojaviti ako određeni uvjeti traju. Inženjerska prosudba, uz podršku metrike visine nabora i iskustva u oblikovanju, ključna je za upravljanje tim rizikom.
7. Područje nabiranja (Ljubičasto)
Kada materijal uđe u zonu nabora, vidljivo stvaranje nabora je već nastalo. Time je kompromitiran i izgled i funkcionalnost. Inženjeri moraju prerađivati dizajne alata ili mijenjati raspored vlačnih rebra kako bi uklonili ili kontrolirali nabore.
Zašto je FLD važan u automobilskoj CAE analizi?
Korištenjem FLD dijagrama unutar AutoForma, inženjeri mogu simulirati i predvidjeti probleme u fazi projektiranja. To pomaže da se:
·Ukloni metoda pokušaja i pogrešaka tijekom razvoja alata
·Smanji vrijeme i troškovi proizvodnje
·Poboljša kvaliteta i ponovljivost u masovnoj proizvodnji
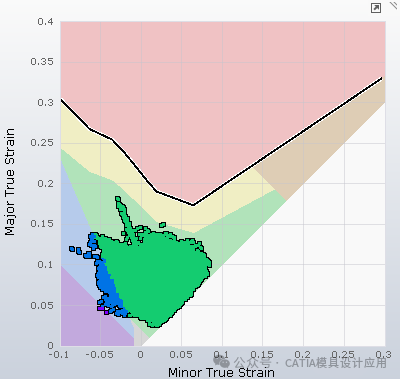
Analiza primjene u stvarnom svijetu
Ispod je primjer FLD grafikona iz stvarne simulacije komponente. Možete li prepoznati da li je ovaj dio podložan pucanju ili stvaranju nabora? Je li većina točaka deformacije u zelenoj zoni ili postoje zone zabrinutosti?
Slobodno podijelite svoju analizu u komentarima – rado ćemo pročitati vaše tumačenje!